While checking my feed reader for the day, I noticed that Andrew Gelman had come across the same set of maps by Eric Fischer that I referenced in the previous post. Intrigued, I checked the comments. At the time, the final comment was this one from Steve Sailer:
It would really make it quicker for viewers to grasp these graphs if dot colors weren’t randomly assigned. It’s too hard to decode a map in which ethnicities are arbitrarily assigned. It’s too hard to remember that Asians are green, Hispanics orange, blacks blue, whites red, and so forth.
Instead, American culture has well-known stereotypical colors for each ethnicity: black for blacks, and so forth. Assuming you want a white background to your map, that leaves the question of what to do with whites. I usually use blue, because blue eyes are only found in whites.
I posted a comment disagreeing with the above. Shortly thereafter, Gelman posted a response directed at a commenter who had posted shortly before me also in response to Sailer. I then posted a second comment elaborating on some of my views. While posting the second comment, I realized that I could test some of my intuitions on the matter by simply changing the colors on one of Fischer’s maps. This post is essentially an explanation of the results.
I chose to focus on Fischer’s map of Chicago for a few reasons. First, the original map by Bill Rankin on which Fischer modeled all of the maps in the set was of Chicago. Second, the Chicago area offers both densely and moderately populated areas, making it a good template for testing map coloring. Finally, Chicago has a significant number of people from the four groups germaine to the map: whites, blacks, Hispanics, and Asians.
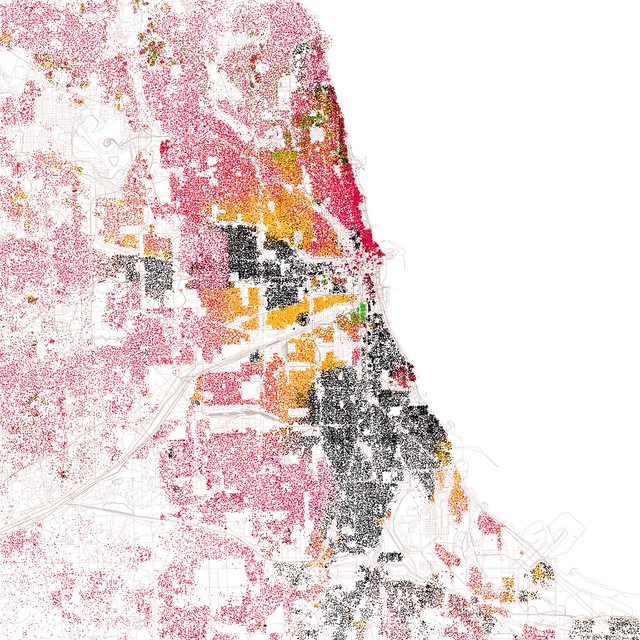
So, for reference, here is Fischer’s map of Chicago:

Fischer’s coloring scheme is almost exactly the same as Rankin’s, with an exception. The color for whites in Fischer’s map has a lower blue value than Rankins, making it more of a red than a magenta. It seems that the value is 100 points lower, suggesting that the difference is a result of an input error, though it may also have been intentional.
Regardless, I generally approve of the color scheme with one objection: the yellow-green used for Asians is both hard on the eyes and somewhat difficult to differentiate from the golden color used for Hispanics. This difficulty of discernment is present both in the case of a map resized to fit a screen (or the column width of a blog post) and when looking at details of the map in it’s full 3009×3009 resolution
As an example, here is an excerpt from Fischer’s Chicago representing part of Chicago’s north side and the suburb of Lincolnwood.
 In this part of town, there is a mix of all four groups and at least to me, it seems that the colors used for Asians and Hispanics are rather difficult to differentiate.
So, here is a new version of the map where I replaced the yellow-green color used to signify Asians with a darker green without an extra yellow tint. To my eyes, at least, the contrast is greatly improved:

And to take the same detail as above:

However, as you can see, my issue with Fischer’s color scheme is much less extensive than Sailer’s. Now, before I proceed, I want to point out some potential factors that may color Sailer’s view of the maps relative to mine. Andrew Gelman found the same maps as I did, but both he and his source included maps from Fischer in their write-ups, but did not include an image of the Rankin map that Fischer used as a model. On the other hand, my source included an image of Rankin’s map at he beginning of the post.
This is important because Rankin provided a color key in the map and Fischer did not, making the coloration a bit confusing to a viewer who saw Fischer’s maps without previous exposure to Rankin’s. As such it is possible that Sailer’s uneasiness with the color scheme merely arises from the lack of previous context for Fischer’s color scheme.
Regardless, I want to approach the notion put forth by Sailer that it would be better to use black to signify blacks. This view was seconded by Phil:
I agree with Steve that the colors could be better chosen, and I said so on Fisher’s blog. But I don’t like blue for whites either. A stereotypical, offensive-to-some-I’m sure mapping would be something like black for blacks, white for whites, brown for hispanics, yellow for Asians…except what would you use for a background color? Also, you really want all of the colors to have equal visual weight (which the current ones don’t either) and yellow tends to be overwhelmed by other colors.
Pink for “white” people makes sense, since we are kinda pink. I would try pink for whites, reddish brown for hispanics, black for blacks, and maybe orange for asians, and adjust the intensities to try to give them about equal visual weight.
Gelman also endorsed it to some extent by citing past work of his:
Yair and I did white (that is, open circles on a white background) for whites, black for blacks, red for Hispanics, and green for others.
Now, I wasn’t able to find the work to which he was refering and I think that using open circles in the format that Fischer and Rankin used would be unworkable and at the very least untestable by my quick color substitution method. So I won’t be approaching that issue. However, I did make a version of Fischer’s Chicago where I both shifted the green color for Asians and changed the blue used for blacks into black. Here it is:
For further reference, here’s the same detail as above:
 Generally, I’m not a fan. It does still convey the same information and perhaps with less strain on the eyes than the cyanish-blue that Ranking and Fischer chose, but it also shifts the balance in emphasis between the categories as well as perceptions of weight.
Black is obviously a darker color than all the rest and thus gives the black dots more weight than those of other colors. For instance, one could easily be fooled into thinking that some of the areas on the predominantly black south side of Chicago are more densely populated than the predominantly white area north of Navy Pier because the black areas “look darker” as compared to the white background of the map.At the same time, I find my eyes gravitate toward the colored areas of the map. The roads are colored gray and that helps in making the black dots appear as part of the background.
Ultimately I don’t think that the tug of war for the viewers attention ends up balancing out. What happens is that a viewer intuitively both over- and underestimates the importance of the black dots relative to the other colors, depending on the context. In the broad map, my focus moves to the north and west relative to the unmodified map and in the detailed section, I can pick out black dots individually with relative ease as compared to the blue dots in the original, even when and especially when they make up a relatively small percentage of the total population in an area.
I do want to take a brief detour before returning to the full color scheme advocated by Sailer. One aspect of Rankin and Fischer’s color scheme is the relative brightness and “softness” of the colors. The magenta and cyan that dominate the map make it fairly easy on the eyes. However, this comes at some cost to the contrast between the colors. Here’s a version of the map where I shifted the colors used for whites and blacks from the magenta and cyan hues to red and blue hues:

It is admittedly a bit harder on the eyes. The red and blue aren’t fully saturated but the red no longer uses any blue subpixels on your monitor and neither does the blue use green subpixels. The improvement in contrast becomes clear looking at the excerpt transformed yet again:
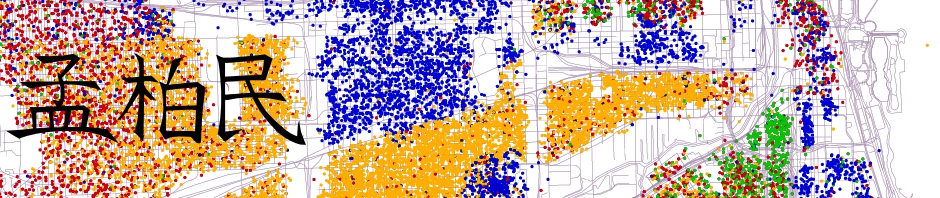
 Now to come back to the main focus of this post, I’ve done my best to switch the colors in Fischer’s map to match the color scheme advocated by Sailer in his comment. Because the colors he advocated were wholly different than those in the original map, there are some artifacts of the color swap process I used, most notably the black dots have blue “halos”, which interferes a bit with the presentation:

All the colors used here are the same as the one’s used in the previous modification, though applied to separate groups. That is, the red I used for whites is now being used for Hispanics, the blue I used for blacks is now being used for whites, and the yellow that I carried over from Fischer to use for Hispanics is now being used for Asians. Obviously there is no green and blacks are now coded with black. Here’s the excerpt again:
 I can’t say that I’m a fan. Ultimately, Sailer’s rationale for the color scheme was to make it more intuitive to the average American viewer of the map who could more easily associate black with blacks, yellow with Asians, red with Hispanics, and blue with Whites. It doesn’t have that effect for me, thoguh I was primed differently than Sailer was in my first exposure to Fischer’s maps and by the time of this post, I’ve become familiar enough with the patterns in the map that the color doesn’t matter much.
However, I don’t think that this color scheme does a particularly good job of illustrating the patterns involved. Rankin and Fischer’s maps take on a peculiar format that really does work best when comparable colors are used. Because the dots illustrate both identity and concentration of people in and area, they really need to have a similar weight and such does not happen when black is used as one of the colors in the palette. Black may work better in a solid area map such as the inset map in Rankin’s Chicago map (as can be seen in the previous post).
Ultimately, I’ll leave this up to you the reader to decide. I came into this exercise with a set of biases already in place and if you compare what I’ve written here to my comments at Andrew Gelman’s blog, you’ll find that while this post is much more verbose and detailed than the comments, my basic position hasn’t changed much, which is a suggestion that either I am right, that I was heavily swayed by confirmation bias, or perhaps both. If anyone wants me to post more alternate color schemes, I’d be happy to do so.


Thanks. Wow. Very helpful.
Dot maps definitely have a whole set of issues that I hadn’t thought about.
Now, what do you think about colors for simple bar charts? I see a lot of them where the colors have been chosen to not coincide with expectations, which winds up being too more my middle aged working memory to handle: “Okay, so American Indians are Green, Asians are Purple, Hispanics are Red, Whites are Black, and Blacks are White … wait a minute, what was that again?”
When it comes to bar charts, I agree. You can usually structure bar charts in a way that makes colors unnecessary (though often still helpful), so choosing intuitive colors is a greater priority than in the dot maps above where color serves a function that is more deeply integrated with the patterns in the map.
Thanks for taking the time to do this. It’s very interesting.
To some extent you/we are reinventing the wheel: I know I have seen work from at least fifteen years ago (maybe by researchers at IBM?) about how to design graphics so that different colors have equal visual weight, and also research on how to create intensity or saturation scales that people perceive as linear. Perhaps some searching on the intertubes would turn up the work I’m thinking of, and doubtless a lot of related research as well. Whatever you (or we) discover is going to turn out to be “well known” to the kind of people who know this kind of thing well.
One thing that is striking is the aesthetic differences between the maps. The original maps are fairly attractive; the one with my suggested color scheme is somewhat ugly; and the one with Steve’s scheme looks horrible.
I don’t remember very much of the colormapping work that I looked at a long time ago, but I do recall a few principles. One that will not surprise anyone is that if you vary some parameters (such as R, G, or B value) linearly, the perceived colors do not seem to vary linearly or even monotonically. That’s an almost impossible sentence to understand, sorry. What I mean is: look at a rainbow. Our eye separates it into distinct colors — a band of red, a band of yellow, a band of blue, etc. — even though the dominant wavelength is varying continuously across those perceived boundaries. Another thing I remember is that our eye treats red differently from other colors: a bit of red in a field of green or blue or white stands out more than a bit of anything else of the same intensity. Note the upper left part of the map that uses Sailer’s color scheme…lots of little red (Hispanic) blocks that stand out far more on this map than on the original.
One thing I’m not sure of is which of the maps does a best job of conveying the quantitative information. Meng complains that my color scheme shifts the visual weights from the original, which is true…but is that a good thing or a bad thing? If we were to ask, say, “what fraction of the city’s population is Asian” (or black or white or Hispanic) which map would lead to better estimates or faster estimates? That said, I do think that blacks get too much visual weight in my scheme. Perhaps that could be adjusted by making them dark gray instead, or brown. It will still be uglier than the original map, though.
Pingback: Two interesting points | Meng Bomin
Dot size is interesting. The choice made here is anti-urban/pro-suburban.
That’s true, at least in the context of Chicago, and even more so in the case of New York. However, it seems very effective for smaller cities like Madison and Des Moines. It’s not too bad for more mid-level cities like Milwaukee and Detroit either (you can see my midwest bias there).
Pingback: Linkage is Good for You: Obvious Phallic Symbolism Edition (NSFW)
Pingback: Various Colors Available to Choose Granite Countertops | i-GoGreen